

Results & Reports
Dashboard
Every run of the project rolled into one view, counters, pass-rate trend, and status over time.
Where a run report covers a single execution, the Dashboard rolls every run in the project into one view, the closest thing to a test execution status report across your whole suite. Open the Dashboard page when you want the trend rather than one result.
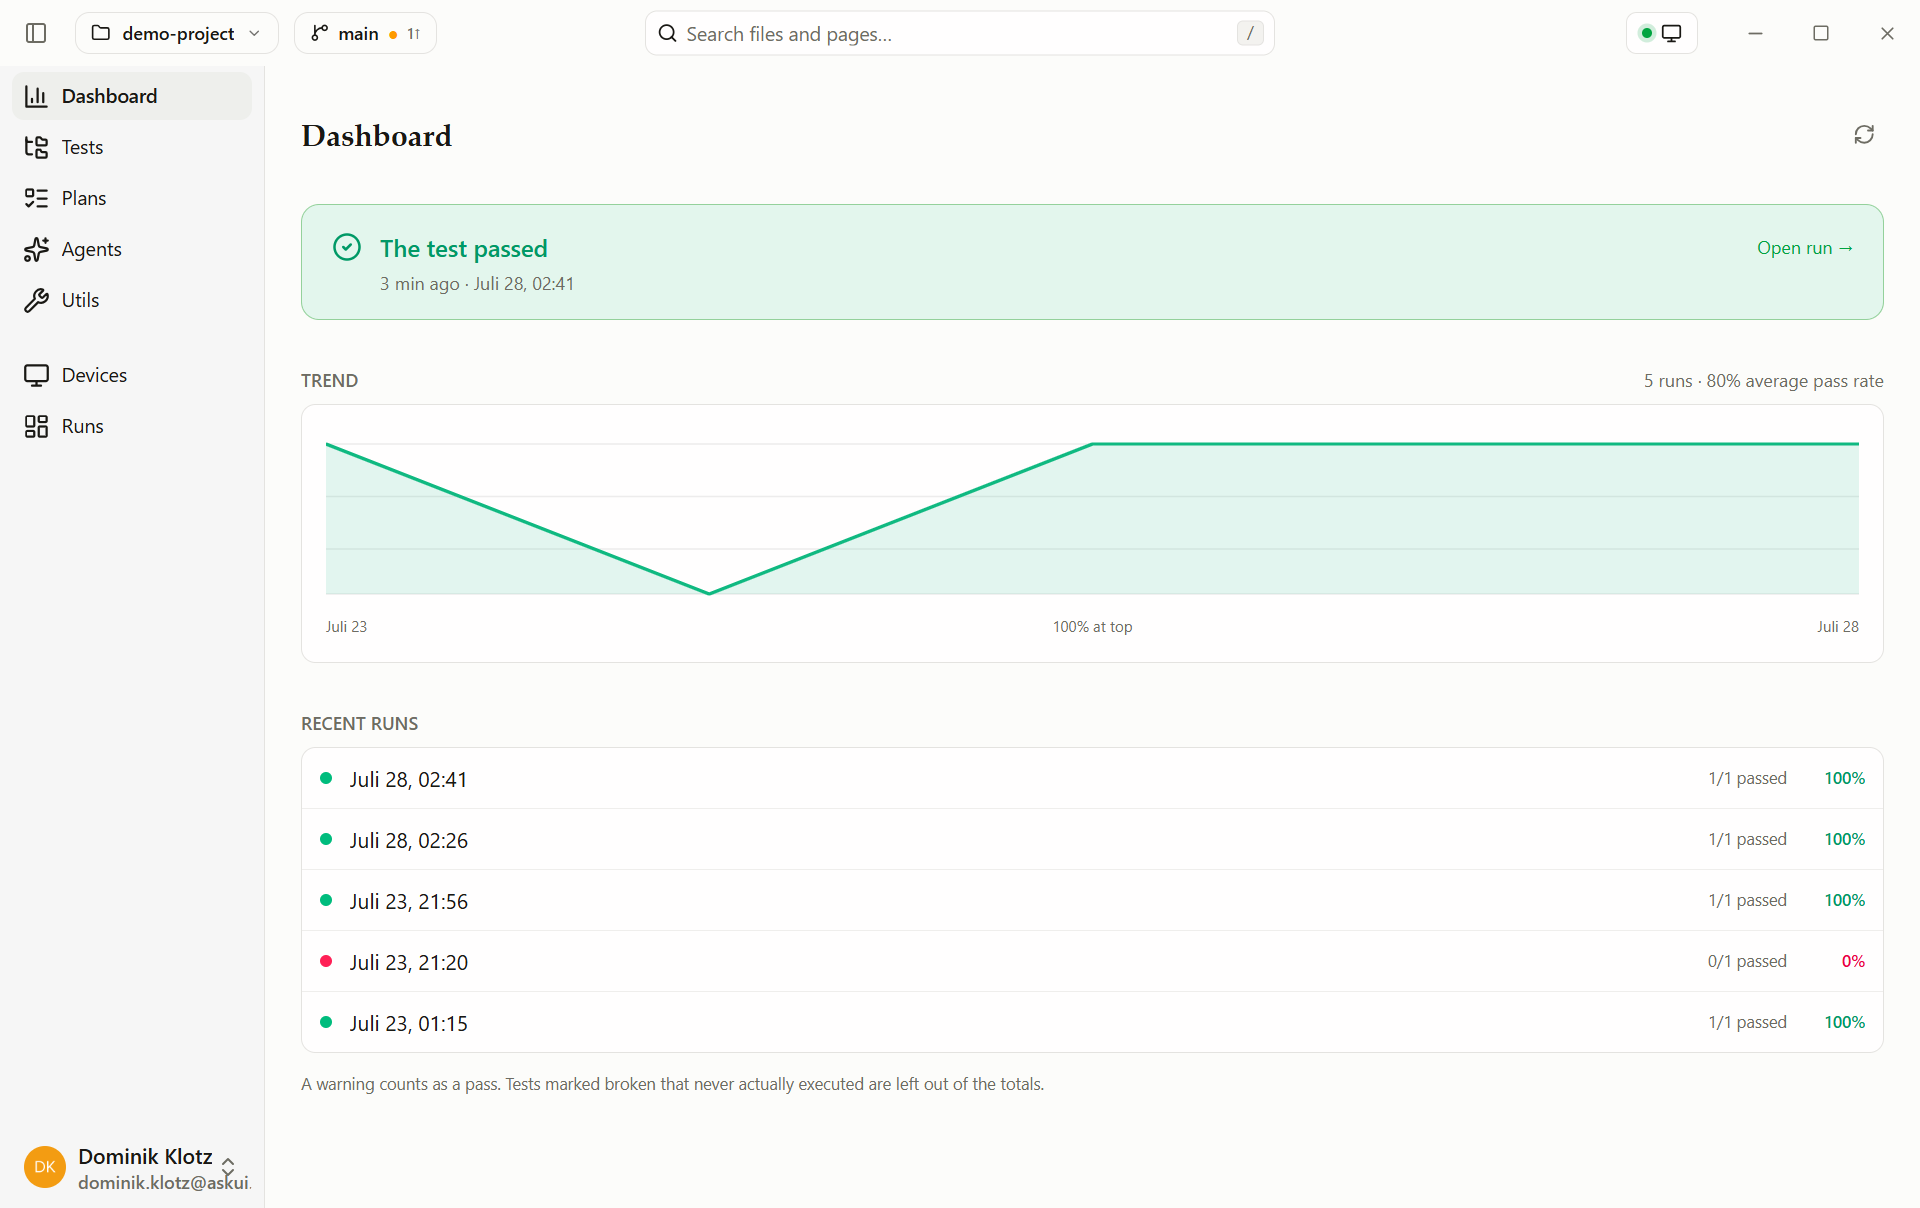
Section by section:
- In flight: what is running or queued right now — green dot running, amber dot queued with the reason it waits. Links to the Runs page. Shown only while something is active.
- Upcoming schedules: the next few schedules by their due time. Shown only when schedules exist.
- The verdict: one sentence on the latest run — did it pass, and when.
- Needs attention: the failing or broken tests of the latest run, each a link into its report.
- Trend: pass-rate over the recent runs, once there are at least two.
- Recent runs: the run history, newest first.
The numbers derive from each run's summary report, the counting rules live there.