

Run a test
Start a run from the Tests page and watch the agent execute it live.
Start a run
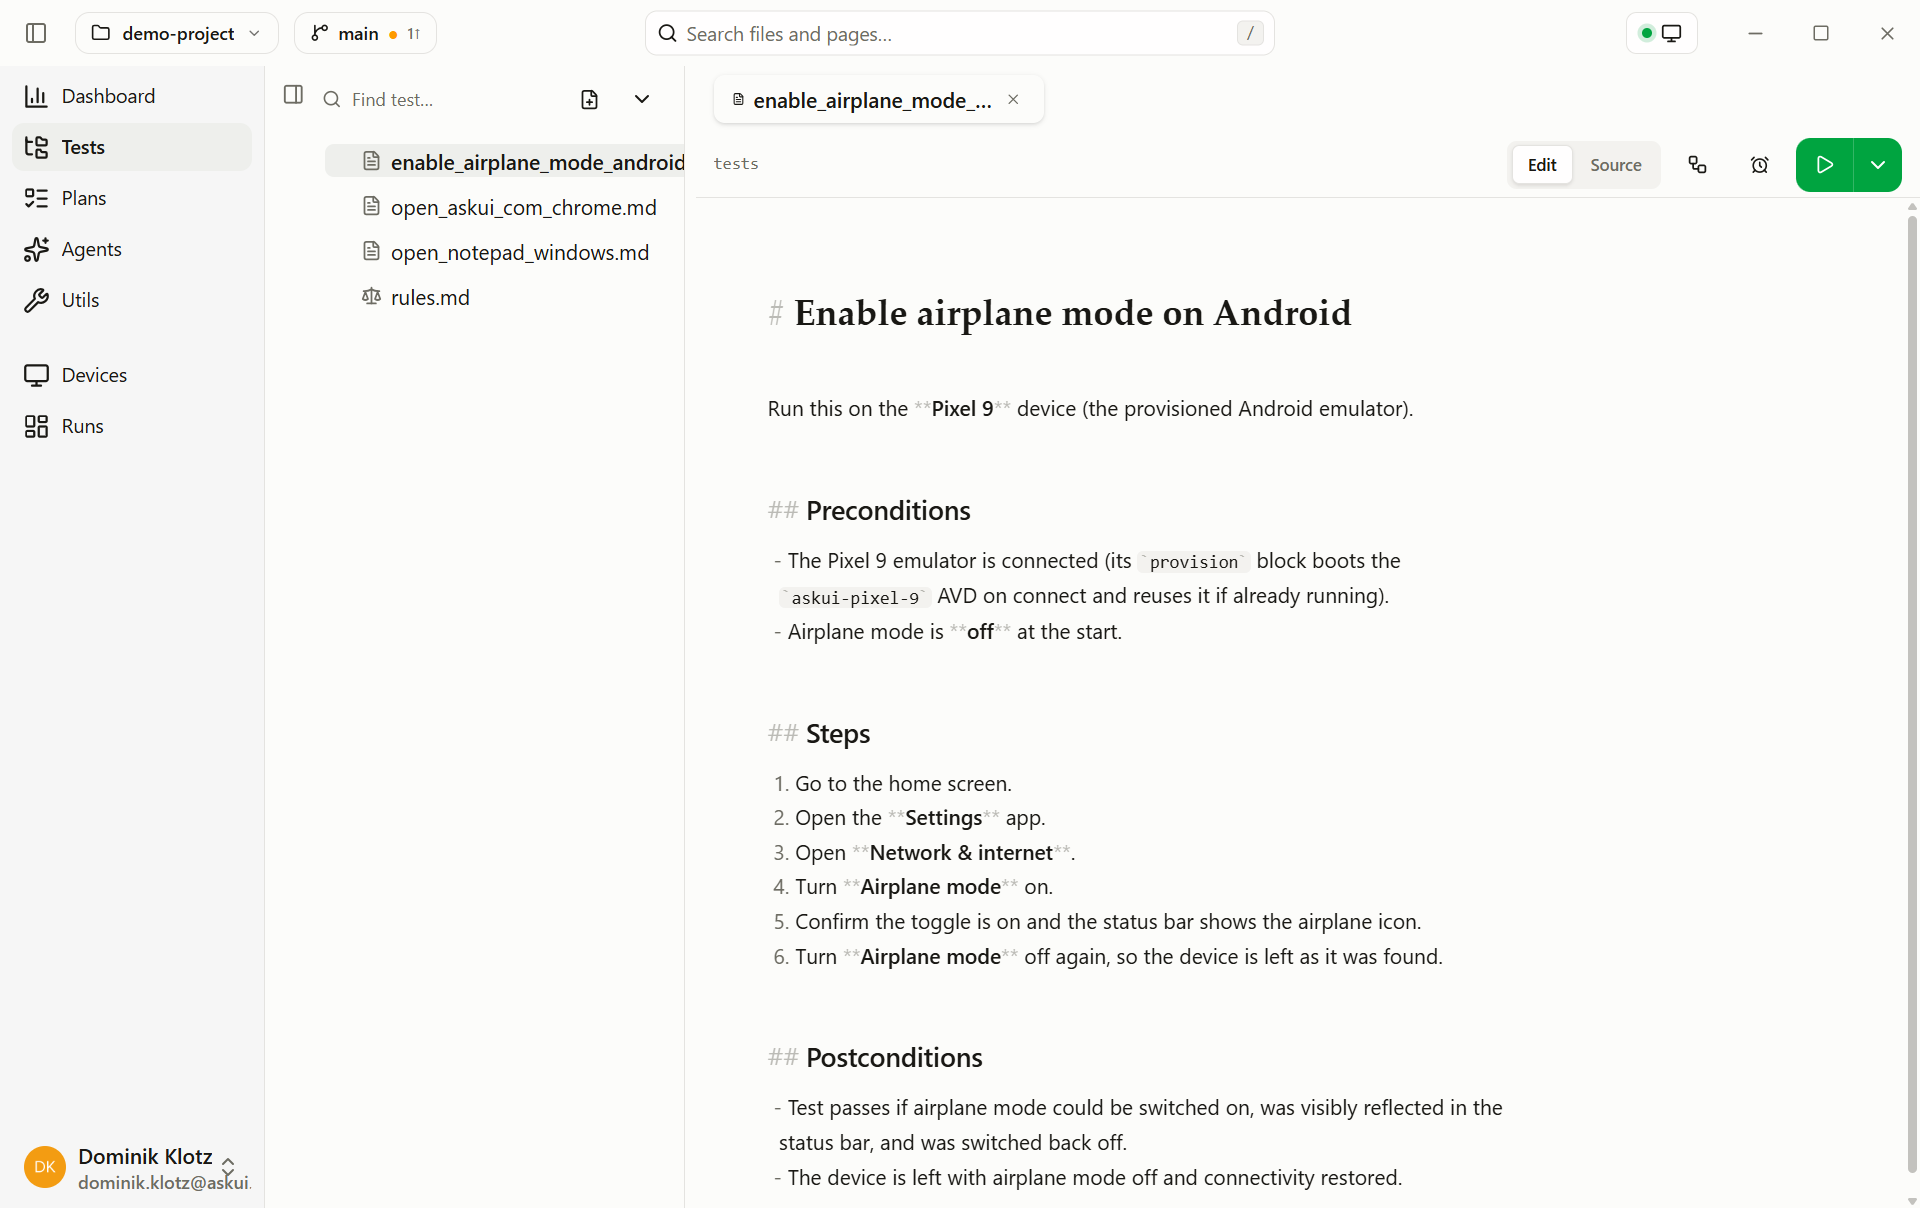
- Open the test on the Tests page.
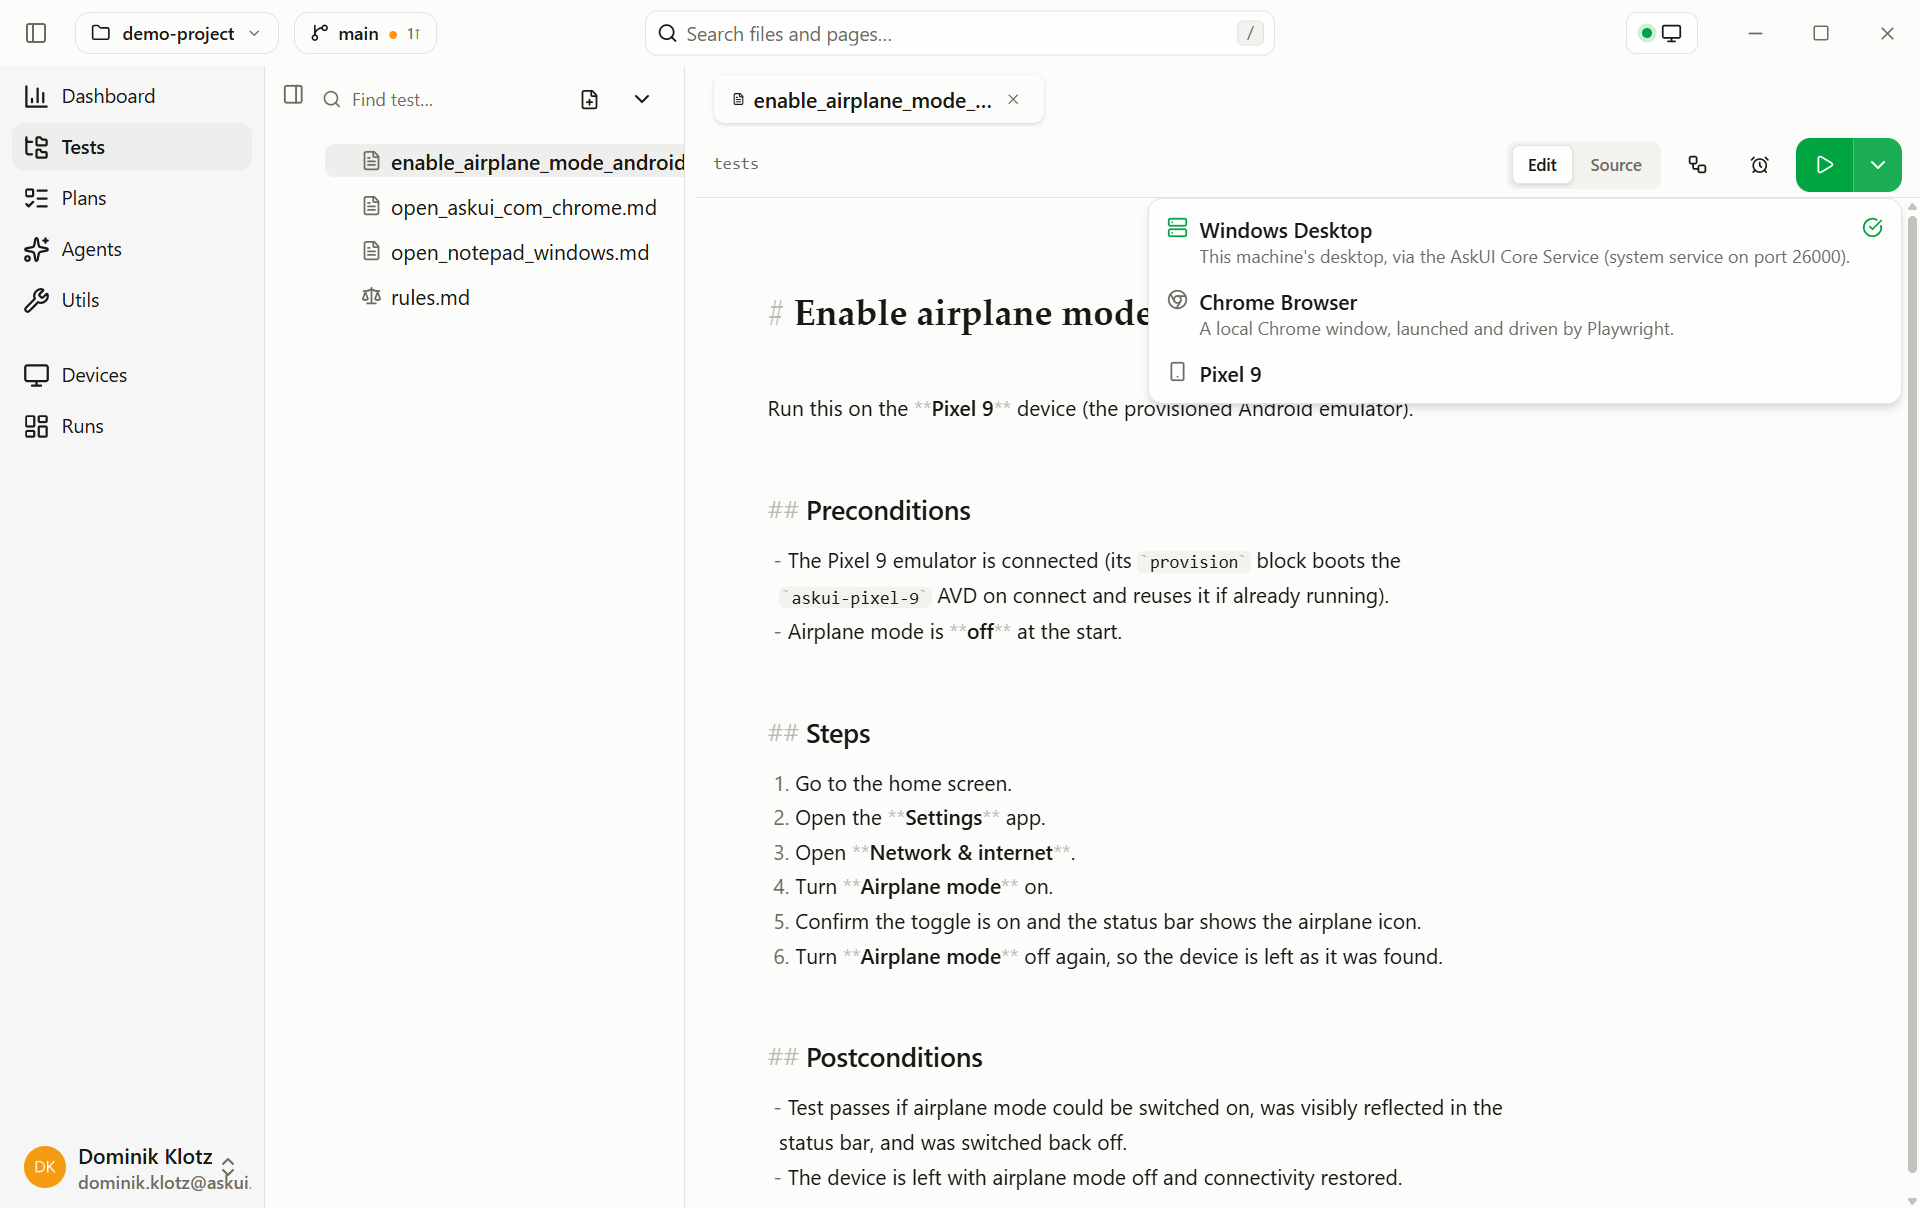
- Pick a connected device in the Run on dropdown (see Devices).
- Press Run, or use its split menu to run the whole folder. For a saved multi-test selection, run a test plan from the Test Plans page instead.
If it can't start right away
A run needs its device to itself, and the app runs at most two runs in parallel (on different devices — two runs never share a device). When you press Run and the run cannot start immediately, a dialog asks what to do:
- Queue run: the run waits its turn and starts automatically as soon as the device is free and a parallel slot opens. A queued run gives up after 30 minutes of waiting, with the reason recorded in its result.
- Don't start: nothing is queued, nothing runs.
Queued runs appear in the Runs sidebar under Queued, each with the reason it waits; the ✕ on the row cancels it. Runs started by a schedule skip the dialog and queue silently.
Closing the app discards the queue — you are warned first when anything is still queued or running.
What a run does
The agent works in phases: the folder's setup.md first, then the tests,
then teardown.md, with rules.md applied throughout. Each phase is one
agent execution: read the file, drive the UI, write a report with
screenshots. A failing setup records its tests as broken, the entry
criteria weren't met.
Watch it live
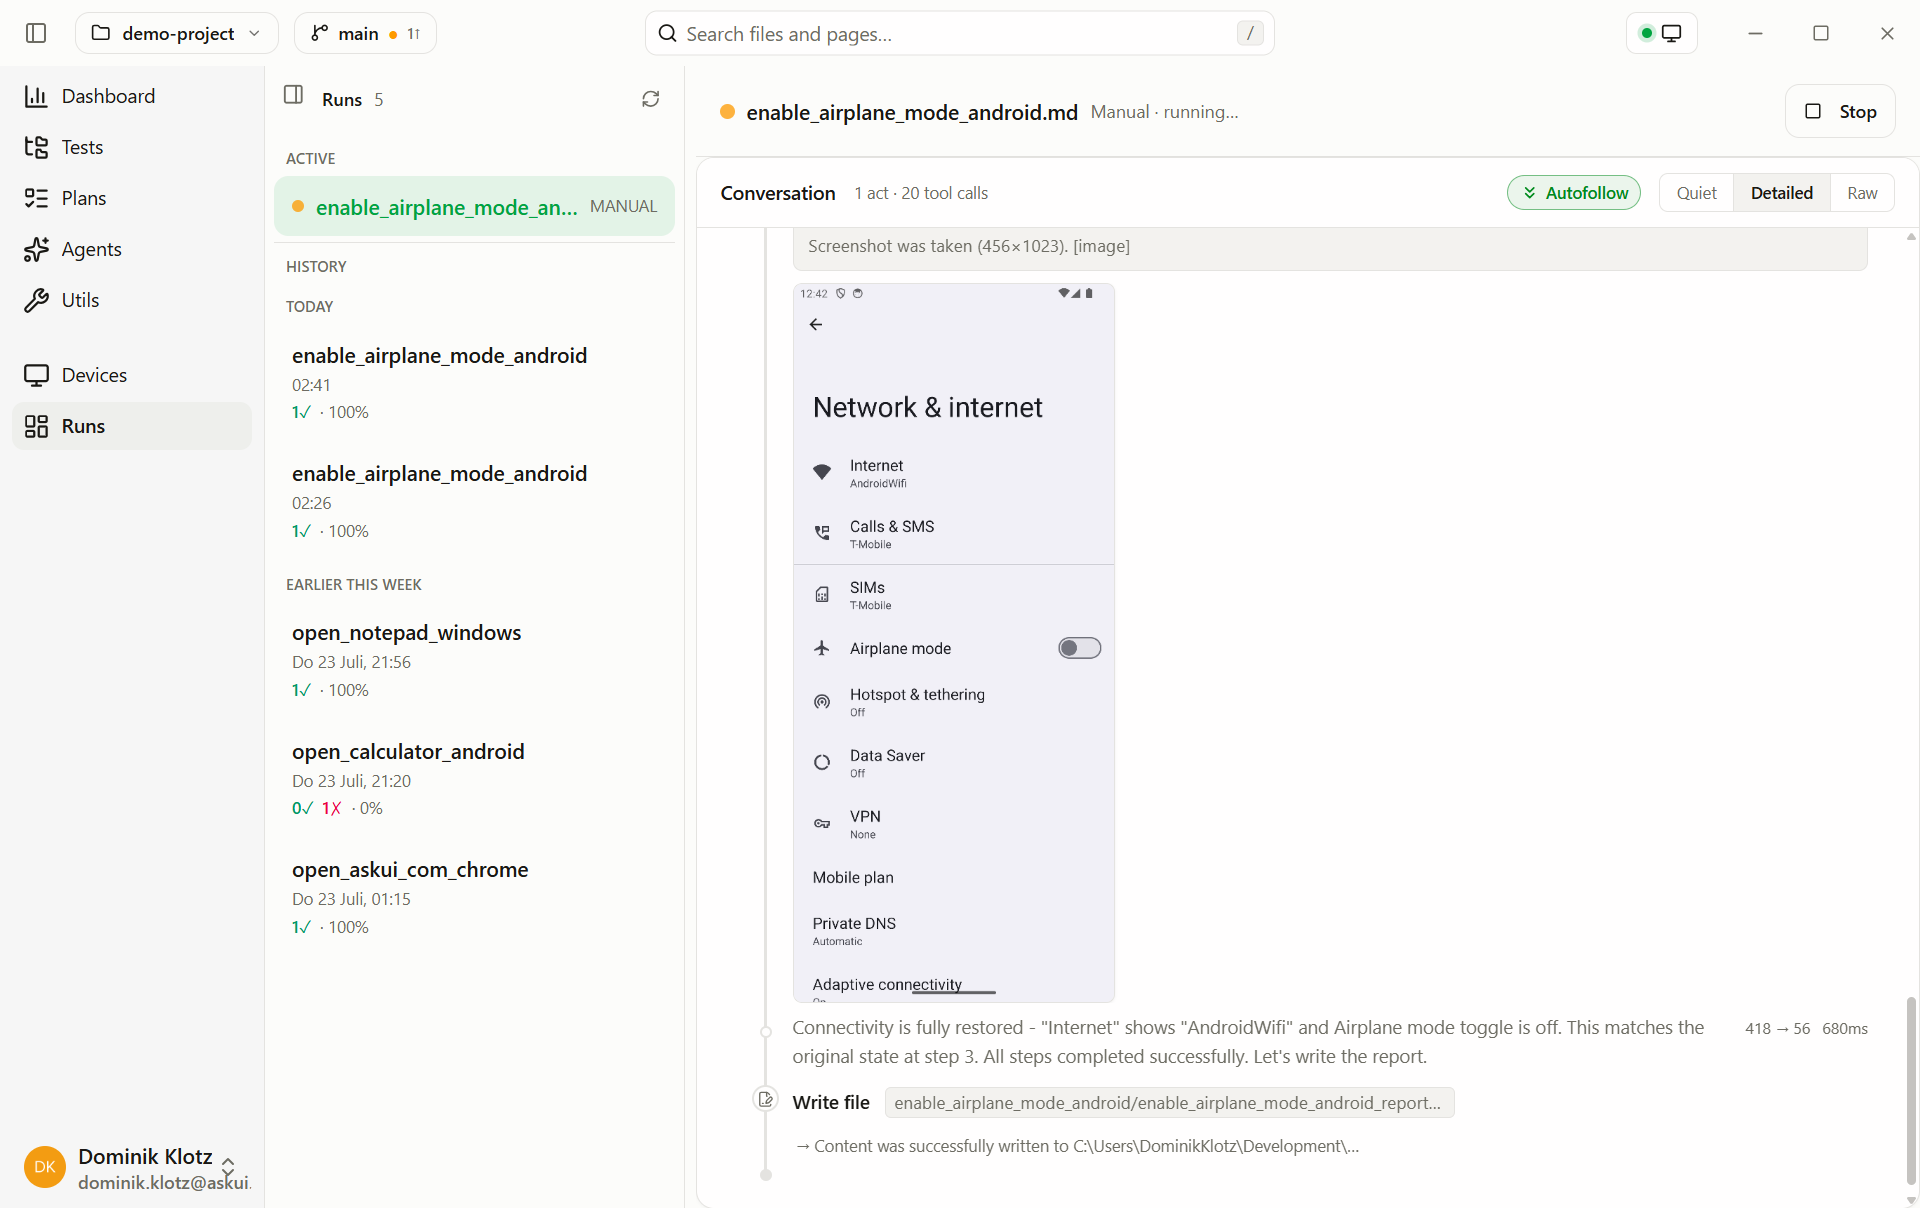
The conversation is the live test execution log, every message, tool call, and screenshot as it happens. Use it to catch unexpected behaviour before the report exists.
- Open the Runs page.
- Pick the run in the runs sidebar on the left, it lists every run of the project, and several runs can be active at once; each streams its own conversation.
- Read the bar at the top of the conversation. It is the run's header, and it states, from left to right: a dot that pulses while the run goes, the icon for a test run or a plan run, the run's name, what started it, how many tests the run is for (setups and teardowns are not counted), and how long it has been running. A run still waiting for its device says Waiting… there instead: the queue is not time the run spent working.
- Follow along with Autofollow, at the right of the same bar: it keeps the view pinned to the newest entry; scroll up to inspect something and it pauses, click it to snap back. It is offered only while the run is live, since nothing more arrives once a run has finished.
- Cut a run short with Stop, beside Autofollow. It reads Canceling… until the run unwinds. A run that has not started yet still shows the bar, so you can stop it before it does.
- When the run finishes, the view becomes the finished run's log, with the outcome counts and the cost. It is the same view you get by picking the run in the list, see results.
There is one view of the conversation, and it holds everything: the agent's narration and every tool call with its result, output, and screenshots.
Reading the conversation
- Numbered circle + TEST header: one phase (setup, a test case, teardown) with its file path, status badge (PASS/FAIL), and how many tool calls it took, this is where you see each test. Expanding a phase reveals a collapsed System prompt section, the exact standing instructions the agent received for that phase.
- Text lines: the agent's narration, what it sees on screen and what it decides to do next.
- Chips: tool calls, a screenshot, a keystroke, a click, or a named tool like Save screenshot / Write file, with the result behind it.
The same view stays available after the run finishes, see the conversation log on the results page.
After the run: read the report. Recurring runs: Scheduling. Headless / CI: CLI.